
Let's analyze the sales of Console Games. We are tasked to extract insights from the company.
The dataset we will be using is the Console Games Dataset. I have imported the data into my MS SQL Server (Transact SQL).
Table Design:

Challenge #1: What are the total sales of video games in North America, Europe, and Japan.
SELECT SUM(na_sales) AS TOTAL_NA_SALES,
SUM(eu_sales) AS TOTAL_EU_SALES,
SUM(jp_sales) AS TOTAL_JP_SALES
FROM [dbo].[console_games];
Result:
In North America, the total sales were 4310.5M copies, in Europe, it was 2382.36M and in Japan it was 1266.38M.
So what if I had to get the total sales in the world. The easier method would be to create a column to have total sales.
Challenge #2: Create a new column to get the total sales.
ALTER TABLE [dbo].[console_games]
ADD global_sales float;
UPDATE [dbo].[console_games]
SET global_sales = na_sales + eu_sales + jp_sales + other_sales;
Result:
I have a new column with the global sales.

Challenge #3: What percent of global sales did North America constitute?
ALTER TABLE [Conole Games].[dbo].[console_games]
ADD percent_na_sales float;
UPDATE [Conole Games].[dbo].[console_games]
SET percent_na_sales = (na_sales*100)/global_sales
WHERE global_sales>0;
Result:
I have a column with the % of NA Sales for every game on every console.

Challenge #4: Get statistics about top 10 performing platforms by sales and game releases.
SELECT TOP(10) platform_name, SUM(global_sales) AS total_sales_by_platform,
COUNT(platform_name) AS no_games_released,
SUM(global_sales)/COUNT(platform_name) AS avg_sales_per_game
FROM [Conole Games].[dbo].[console_games]
GROUP BY platform_name
ORDER BY total_sales_by_platform DESC, avg_sales_per_game DESC;
Result:
We get the number of units sold, number of games released and the average number of copies sold per game for the top 10 platforms.

The sales of PS2 and Xbox 360 have the highest and Xbox selling 786K copies on average per game.
Challenge #5: What are the consoles for which the games are sold presently and how have they done?
SELECT platform_name, SUM(global_sales) AS total_sales_by_platform
FROM [Conole Games].[dbo].[console_games]
WHERE platform_name IN (SELECT DISTINCT(platform_name)
FROM [Conole Games].[dbo].[console_games]
WHERE game_year = (SELECT MAX(game_year)
FROM [Conole Games].[dbo].[console_games] )
)
GROUP BY platform_name
ORDER BY total_sales_by_platform DESC;
Result:

Among the console games that are selling currently (2015 in this case) Xbox 360, PS3 and Wii have the highest sales.
Challenge #6: Find the compound growth or decay rate of each console over time.
SELECT platform_name, (POWER(last_value/first_value,1/(number_instances*1.0))-1)*100 AS growth_rate
FROM (SELECT DISTINCT(platform_name),
FIRST_VALUE(global_numbers) OVER(PARTITION BY platform_name ORDER BY game_year ROWS BETWEEN UNBOUNDED PRECEDING AND UNBOUNDED FOLLOWING) AS first_value,
LAST_VALUE(global_numbers) OVER(PARTITION BY platform_name ORDER BY game_year ROWS BETWEEN UNBOUNDED PRECEDING AND UNBOUNDED FOLLOWING) AS last_value,
COUNT(platform_name) OVER(PARTITION BY platform_name) AS number_instances
FROM (SELECT TOP(500) platform_name, game_year, SUM(global_sales) AS global_numbers
FROM [Conole Games].[dbo].[console_games]
GROUP BY platform_name, game_year
ORDER BY platform_name ASC, game_year ASC) age1) age2
ORDER BY growth_rate DESC;
Results:
Compound Growth = (Sales in the first year/Sales in the last/recent year)^(1/Number of years the product was sold) - 1
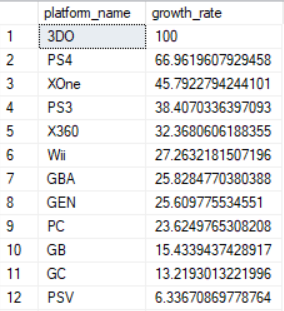
The sales of PS4 and Xbox One have the highest growth rate over their sales period.
That's it for aggregation functions. In the next post we look at joins.